Much of the data generated by the LISMaRC team for the Phase II area is now available for viewing and download from a new page that provides a brief summary of each of the thematic areas of the LIS Cable Fund project with links to the respective chapter from the Phase II Final Report and a link to a data summary table for each element. The data table provides an image of the map product, where available, links to the metadata for each, and links to either an ESRI shapefile for the maps, PDF versions of the data from the spreadsheet databases and other map products in the standard LIS Cable Fund map template.
The Long Island Sound Mapping and Research Collaborative (LISMaRC) has completed its Final Report for the Phase II Long Island Sound Cable Fund Habitat Mapping initiative. The report includes details on the five major elements of LISMaRC’s contribution to the initiative including: 1) acoustic data acquisition and processing, 2) sediment grain size and distribution, 3) seafloor/habitat characterization , 4) ecological characterization and 5) physical oceanographic characterization. The Final Report is available HERE and under the Products tab of this website.
A preliminary report of the results of the Ecological Characterization component of the Long Island Sound Mapping and Research Collaborative’s (LISMaRC) contribution to the Long Island Sound Cable Fund Habitat Mapping Initiative: Phase II – Eastern Long Island Sound has been developed that includes a set of preliminary maps illustrating progress to date assessing the infauna and epifauna of the Phase II area. This report was prepared in response to a request for preliminary map products from Connecticut Department of Energy and Environment (CTDEEP) to inform discussions with the Equinor Corporation pursuant to its development of the Beacon Wind offshore wind project, specifically regarding routing options for the subsea cable to bring the power to shore. This response is, therefore, congruent to the framework for the LIS Cable Fund to provide the best available science to inform sound management decisions. Moreover, this report provides information that can be used by a broad suite of stakeholders interested in this and similar sustainable energy infrastructure projects in general. It is also important to note that while the results presented in the report have gone through degrees of internal review the results are preliminary with preparation of the final project report in progress. The report is available here. A geodatabase providing shapefiles for the ecological data presented is available by request.
The LISMaRC partner, the US Geological Survey (USGS), has recently published the data collected during two marine geological surveys conducted in Long Island Sound, Connecticut and New York, in fall 2017 and spring 2018.The surveys were conducted using the SEABed Observation and Sampling System (SEABOSS) operated from the Research Vessel (RV) Connecticut. The SEABOSS collected sea-floor images and videos at 210 sampling sites within the Phase II area, and surficial sediment samples at 179 of the sites. The sediment data and the observations from the images and videos are used to identify sediment texture and are core components used to identify sea-floor habitats.
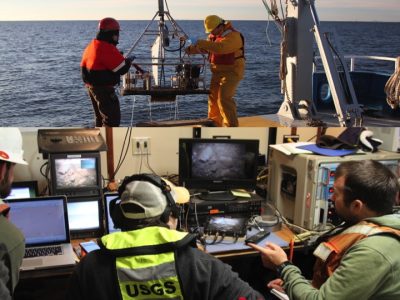
Split image of launching the SEABOSS from the RV Connecticut (top) and the SEABOSS Control Station set up in the dry laboratory (bottom). Image courtesy Ivar Babb and LISMaRC Science Team (UConn/U New Haven/USGS), Long Island Sound Study, CT-DEEP
The data release provides access to the locations and grain-size analysis results of surficial sediments collected with a modified Van Veen grab sampler on the SEABOSS during USGS field activities 2017-056-FA (November 28 to December 3, 2017) and 2018-018-FA (May 8 to 15, 2018). These data were collected to explore the nature of the sea floor and to characterize the seabed by identifying sediment texture. The sediments were analyzed using two different methods: the Beckman Coulter Multisizer 3 and sieving of the >= 4-phi fraction, and the HORIBA LA-960 laser diffraction analyzer and sieving of the >= -2-phi fraction. The HORIBA LA-960 laser diffraction analyzer is a new method for analyzing grain-size distribution at the sediment laboratory at the USGS Woods Hole Coastal and Marine Science Center. This dataset was analyzed using both methods so that the results could be compared. Results of the comparison are not included in this data release.
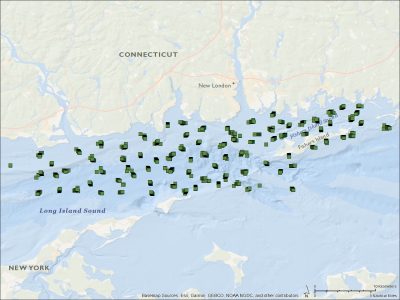
Map of the sample locations collected by the SEABOSS in 2017 and 2018 in the Phase II area by the USGS. Image courtesy of USGS’ Woods Hole Science Center
The dataset also provides access to the sea-floor images (.jpg format) and video clips (.mp4 format) and their locations acquired with a Nikon D300 digital still camera, a GoPro HERO4 Black camera, and a Kongsberg Simrad OE1365 video camera mounted on the SEABOSS. These data were collected to explore the nature of the sea floor and to characterize the seabed by identifying sediment texture. Bottom images and videos serve as a means to visually classify grain size and identify sea-floor habitats, and they are especially important for sample sites where no physical sediment sample was collected.
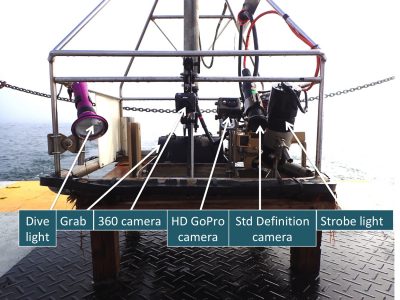
Image of the front of the SEABOSS showing the various imaging systems mounted on the system. Image courtesy Ivar Babb and LISMaRC Science Team (UConn/U New Haven/USGS), Long Island Sound Study, CT-DEEP
The entire data release provides complete metadata and the geotagged sea-floor images, location of bottom images, sea-floor videos, and location of bottom video tracklines collected during the surveys.The data citation and doi access is:
Ackerman, S.D., Huntley, E.C., Blackwood, D.S., Babb, I.G., Zajac, R.N., Conroy, C.W., Auster, P.J., Schneeberger, C.L., and Walton, O.L., 2020, Sea-floor sediment and imagery data collected in Long Island Sound, Connecticut and New York, 2017 and 2018: U.S. Geological Survey data release,https://doi.org/10.5066/P9GK29NM
Physical oceanographers at the University of Connecticut’s Department of Marine Science have been developing maps of the physical attributes of the Phase II area of Long Island Sound Habitat Mapping Initiative. These maps include water temperatures, salinity and bottom stress (a measure of the strength of the water movement over the seafloor based upon both tides and storms). The maps are the output of models that have been developed and refined based upon actual data measured in the Phase II area. The observations were made over the course of several months and two research cruises that used a variety of technologies including CTD (conductivity, temperature and depth) sensors, ADCPs (acoustic Doppler current profiler) and long-term seafloor observatory deployments. These maps are a critical element that will be integrated with the other geological and biological data currently being analyzed to provide a more comprehensive understanding of the dynamics of Long Island Sound.
The slideshow provides a series of maps of the bottom stress predicted in the Phase II area. The first map is of the mean bottom stress over a complete tidal cycle. The second shows the maximum stress predicted due to the tides – note the high values around the area known as the Race between Long and Fishers Islands. The third map is the maximum stress predicted that includes data inputs driven by both tides and storms.
Map of predicted mean tidal bottom stress in the Phase II area
Map of predicted maximum tidal bottom stress in the Phase II area
Map of maximum predicted bottom stress in the Phase II area
One of the first steps that the LISMaRC research team is taking to develop a Habitat Map is to analyze the acoustic backscatter map using Trimble Geospatial’s eCognition software. eCognition is an image analysis tool for remotely sensed data, such as the backscatter data. The backscatter is a measure of the strength of the reflected sound data generated by a multibeam sonar system, with harder bottom types reflecting more sound and softer bottoms absorbing more of the sound. Typically the gray-scale data is set to have darker tones be the absorbed data while the higher reflective surfaces are lighter tones.
Map of the acoustic backscatter data used to generate the eCognition bottom classifications Map from NOAA/NCCOS
The eCognition software analyzes the image and classifies it based upon similarities in the gray scale data, so all the muddy bottom types are grouped together as are the harder sand and gravel areas. This provides a first cut analysis of the seafloor habitat that is then further refined with additional data sets such as the actual sediment type (e.g. grain size analyses).
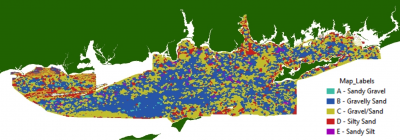
Preliminary map generated by the eCognition software based upon the backscatter map, the colors represent areas of similar bottom type as classified by the software. (Not to be cited or used without permission from LISMaRC and R. Zajac, University of New Haven)
As can be seen, the software parsed the backscatter data into five classes (A-E). The results of the U.S. Geological Survey’s sediment grain size analyses of the 2017 sample sites were used to provide groundtruth data as to the actual nature of the seafloor provided in the map’s legend. More sediment grain size data from the 2018 USGS analyses and the Lamont Doherty Earth Observatory (LDEO) team and other data will be added in the coming months to further refine the eCognition map.
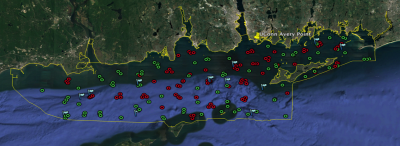
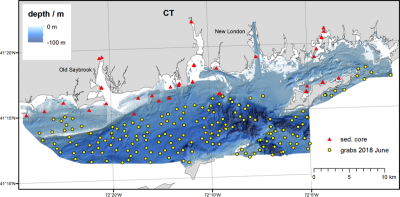
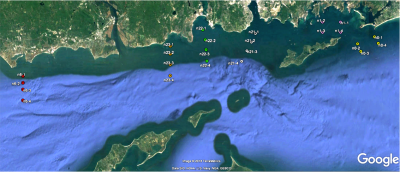
Map of the Phase II sediment sample locations (red dots = Fall, 2017; green dots = Spring, 2018) flags = K2 ROV dive locations Map from LISMaRC/UConn
In the summer of 2018, a group of scientists and students from Lamont-Doherty Earth Observatory of Columbia University and Queens College of City University New York collected additional sediment grab samples and sediment cores using the vessels RV Seawolf and RV Pritchard from Stony Brook University. The RV Pritchard was used for collecting sediment cores in the shallow areas along the northern shore of the study area (Figure 3).
Figure 1. Sediment coring operations on the RV Pritchard (credit: C. McHugh)Figure 2. Students assisting with sediment coring operations on the RV Pritchard (credit: C. McHugh)
Figure 3. Map of the study are in North-Eastern Long Island Sound showing the sediment grab and core locations of samples collected in summer 2018. Background water depth is provided by NOAA
A Nikon KeyMission 360 degree video camera was installed on the USGS’ SEABOSS during several shallow water deployments during the Spring 2018 Phase II sampling/survey cruise on board the RV Connecticut. The 360 camera provided unique perspectives on the underwater environs of the Sound. The video is best viewed using a Virtual Reality Headset from the YouTube page.
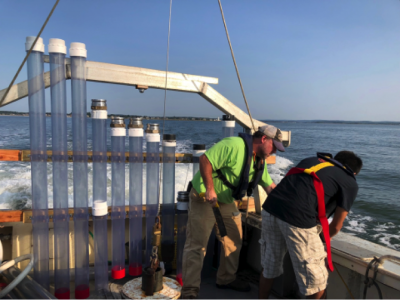
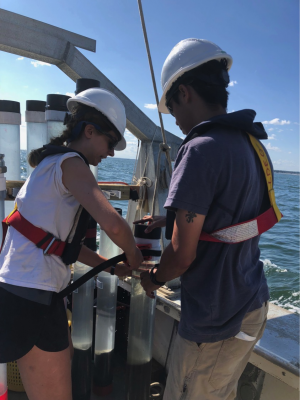
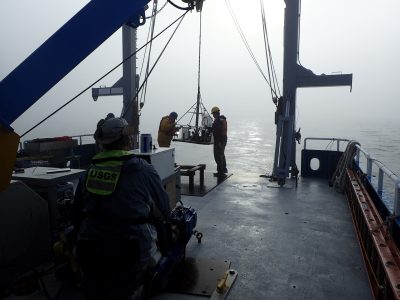
An eight-day cruise was conducted using the Research Vessel Connecticut and the US Geological Survey’s SEABOSS (Seafloor Benthic Observation and Sampling System) from May 8-15th. During the cruise the LISMaRC team visited 59 of the previously identified sample blocks and sample sites. The sample design called for the blocks to be sampled for sediments at three areas within the one square kilometer block and a 500-meter video/photo transect conducted. Only one sediment sample and 500-meter video/photo transect was conducted in the sample sites. The sediment samples collected by the SEABOSS’ modified Van Veen grab were photographed and then parsed into two 2x2x2 cm samples for sediment grain size analyses as described below, with the remainder of the sample processed for infaunal organisms.
Figure 1. Map depicting the progress of the LISMaRC research team in sampling the Phase II area for the ecological and sediment texture goals of the project. The squares are the sample blocks, the circles the sample sites. Click on the map to view a summary of the 2018 SEABOSS cruise.
The SEABOSS also collected 3603 down-looking digital still photographs during the first five days of the survey. However, an intermittent strobe light malfunction arose that the USGS technicians were able to work around by using a down-looking GoPro camera set to collect digital stills on ten-second intervals with illumination provided by a dive light. This approach was employed for the last three days of the cruise, collecting 3545 additional images. The SEABOSS collected 120 standard definition video files recorded on an Odyssey digital recorder and a similar number of hours of hi-definition video recorded by a forward-looking GoPro camera. These images and videos will be analyzed over the course of the next year to determine community structure and biodiversity of the sites.
Figure 2. Launching the SEABOSS in the early morning fog
Nighttime operations during the Spring 2018 SEABOSS cruise focused again on collecting physical oceanographic data needed to characterize the Phase II study area. Transects from the 2017 Fall collection period were reoccupied to assess seasonal variation. Several new locations were added during this cruise looking at cross-bathymetric contours in the eastern half and at the eastern entrance to Fishers Island Sound, and near the western limit of the study area south of Clinton Harbor. As with the previous data collection, a single transect was sampled repeatedly during a 12 hour period with the acoustic Doppler current profiler (ADCP) in constant operation. Stations along each transect were also repeatedly sampled with a Sea-Bird Model 9 CTD (conductivity, temperature, depth) providing profiles of the water column temperature and salinity. Location of the sampling is shown in Figure 3.
Figure 3. Map providing the locations of the physical oceanographic sampling conducted during the SEABOSS cruise. The dots represent sites where CTD (conductivity, temperature, depth) samples were taken. An acoustic Doppler current profiler (ADCP) was run continuously between these sites.
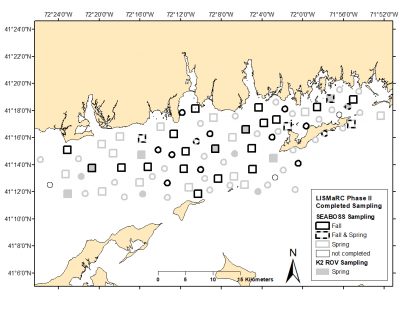
A five-day cruise using the research vessel Connecticut (RV CT) and the Kraken2 (K2) ROV was conducted from May 19-23rd, shortly after the RV CT/SEABOSS cruise. The mission visited 12 of the sample blocks and sites that were identified as being inadequately sampled by the SEABOSS system. This determination was based primarily upon the nature of the substrate being too hard and topographically complex to sample with the SEABOSS. The drift-mode sampling approach of the SEABOSS did not allow extended imaging of the rougher boulder/ledge habitats. The K2 ROV, conversely, is ideally suited to stopping and imaging the vertical surfaces of boulder habitats with great detail with its powerful zoom cameras (both hi-definition video and high resolution digital still). In addition a survey of a previously unidentified wreck site discovered by the SEABOSS was attempted. However, low visibility and high currents precluded adequate documentation of this site. The K2 collected over 30 hours of hi-definition digital video (~2 terabytes) and 412 down-looking and 2050 forward-looking digital still images that will be analyzed over the next year to assess the sites’ community structure and biodiversity.
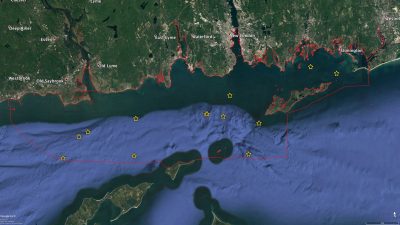
Map depicting the locations of the Kraken2 ROV Spring 2018 dive sites. The red boundary illustrates the extent of the Phase II area.
The K2 ROV cruise revealed some of the most complex terrain observed in the Sound to date. To see an example video, click on this link: https://youtu.be/XKVNCYrSJwo