The Phase I Ecological Characterization component comprised three major elements: 1) characterization of the infauna, ie what lives below the seafloor surface, in the sediments; 2) characterization of the epifauna, ie what lives on top of the seafloor sediments or attached to the harder substrates; and 3) development of a habitat map that integrates both infaunal and epifaunal data along with several other abiotic factors that comprise the seafloor environment. For the Phase I effort teams from the Long Island Sound Mapping and Research Collaborative (LISMaRC) and the Stony Brook University conducted separate, but complementary ecological studies. Descriptions of these efforts are found in the sub-menus.
The ultimate goal of the Long Island Sound Habitat Mapping Initiative is to generate maps that provide up to date information on the abundance and distribution of resources in the Sound to ensure wise management of this vital coastal ecosystem. All of the features of Sound – the geologic history, water depth, sediment type, water temperature and seafloor currents combine to form the patchwork of habitats that support a rich diversity of life. Understanding the relationships between these seafloor landscapes and the organisms that inhabit them is fundamental to obtaining the management goal. This ecological characterization results in habitat maps that integrate all of the information being collected by the LIS mapping teams to provide one of the most important data products. An overview of the Phase I ecological characterization program was reported in the Long Island Sound Study’s Sound Update and can be found here: Ecological Characterization.
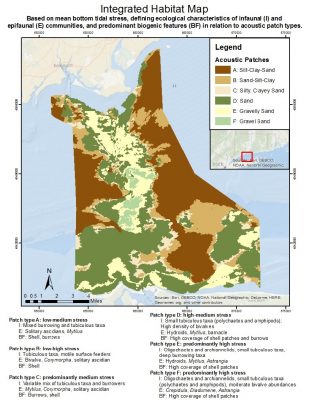
Ecological characterization of such diverse habitats requires a fine scale, multi-pronged approach that builds upon the larger scale mapping provided by the acoustic technologies. Scientists use the acoustic backscatter maps that identify the mosaic of bottom types to guide the selection of sampling sites for ecological sampling. This approach ensures that all of the habitats are sampled and importantly that the transition zones from one habitat type to another is also sampled as these have been shown to areas of high biological diversity.
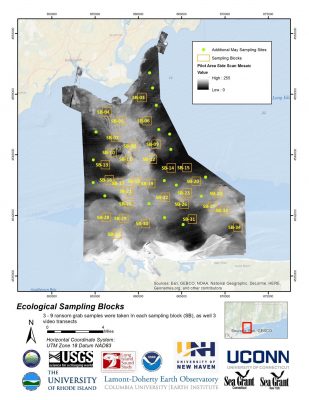
A range of technologies is required to sample the organisms that inhabit the various habitats in the Sound as described here. The physical samplers provide soft sediment grabs that are then sifted on board the research vessel through either a 1 mm or 0.5 mm sieve depending upon the fineness of the sediments to collect all the organisms found within the grab. These infaunal samples are photographed, labeled and then preserved for subsequent analyses in the laboratory to identify and count the species from each grab. Conversely imaging technologies are necessary to document the organisms living on the harder substrates or the more fragile biogenic habitats that can be disturbed by physical sampling. High resolution digital still are assessed using image analysis software to identify all of the organisms visible in the image. These data are augmented by high definition video that provides additional information on species not captured in the still images. Combined these approaches provide detailed information on the distribution, abundance and diversity of the living resources of the Sound.
Descriptions of the technologies used for the Ecological Characterization in the Phase I Pilot can be found in the Sampling and Imaging portions of the Technologies tab: https://lismap.uconn.edu/how-we-map-long-island-sound/
The Ecological Characterization team recognized the importance of sampling in both the fall/winter and spring/summer seasons to fully characterize the diversity inherent in the Sound’s waters. The maps below illustrate the differences in species richness, ie the total number of species in each sample in the Phase I area from fall to spring illustrating the higher number of epifaunal species observed.
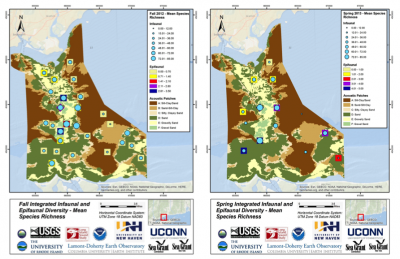
Maps showing Infaunal and Epifaunal Species Richness in the Phase I area in Fall and Spring seasons
These summary findings were extracted from and can be accessed by clicking on the Phase I Final Report.pdf and Appendixes.pdf.
These are also accessible from the Long Island Sound Study page found here: http://longislandsoundstudy.net/research-monitoring/seafloor-mapping