One of the first steps that the LISMaRC research team is taking to develop a Habitat Map is to analyze the acoustic backscatter map using Trimble Geospatial’s eCognition software. eCognition is an image analysis tool for remotely sensed data, such as the backscatter data. The backscatter is a measure of the strength of the reflected sound data generated by a multibeam sonar system, with harder bottom types reflecting more sound and softer bottoms absorbing more of the sound. Typically the gray-scale data is set to have darker tones be the absorbed data while the higher reflective surfaces are lighter tones.
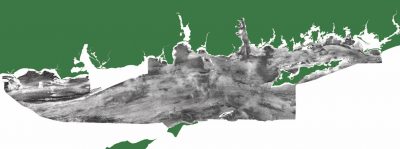
Map of the acoustic backscatter data used to generate the eCognition bottom classifications Map from NOAA/NCCOS
The eCognition software analyzes the image and classifies it based upon similarities in the gray scale data, so all the muddy bottom types are grouped together as are the harder sand and gravel areas. This provides a first cut analysis of the seafloor habitat that is then further refined with additional data sets such as the actual sediment type (e.g. grain size analyses).
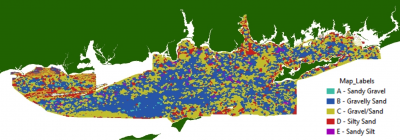
Preliminary map generated by the eCognition software based upon the backscatter map, the colors represent areas of similar bottom type as classified by the software. (Not to be cited or used without permission from LISMaRC and R. Zajac, University of New Haven)
As can be seen, the software parsed the backscatter data into five classes (A-E). The results of the U.S. Geological Survey’s sediment grain size analyses of the 2017 sample sites were used to provide groundtruth data as to the actual nature of the seafloor provided in the map’s legend. More sediment grain size data from the 2018 USGS analyses and the Lamont Doherty Earth Observatory (LDEO) team and other data will be added in the coming months to further refine the eCognition map.
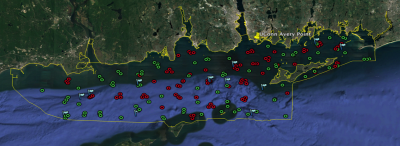
Map of the Phase II sediment sample locations (red dots = Fall, 2017; green dots = Spring, 2018) flags = K2 ROV dive locations Map from LISMaRC/UConn