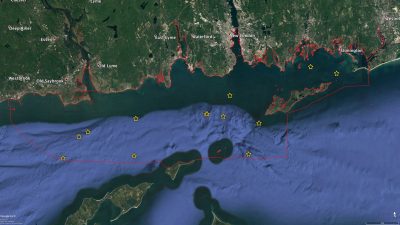
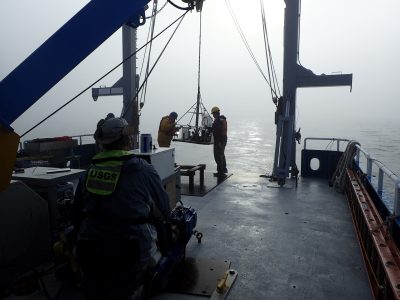
An eight-day cruise was conducted using the Research Vessel Connecticut and the US Geological Survey’s SEABOSS (Seafloor Benthic Observation and Sampling System) from May 8-15th. During the cruise the LISMaRC team visited 59 of the previously identified sample blocks and sample sites. The sample design called for the blocks to be sampled for sediments at three areas within the one square kilometer block and a 500-meter video/photo transect conducted. Only one sediment sample and 500-meter video/photo transect was conducted in the sample sites. The sediment samples collected by the SEABOSS’ modified Van Veen grab were photographed and then parsed into two 2x2x2 cm samples for sediment grain size analyses as described below, with the remainder of the sample processed for infaunal organisms.
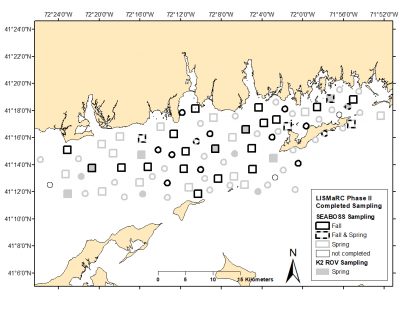
Figure 1. Map depicting the progress of the LISMaRC research team in sampling the Phase II area for the ecological and sediment texture goals of the project. The squares are the sample blocks, the circles the sample sites. Click on the map to view a summary of the 2018 SEABOSS cruise.
The SEABOSS also collected 3603 down-looking digital still photographs during the first five days of the survey. However, an intermittent strobe light malfunction arose that the USGS technicians were able to work around by using a down-looking GoPro camera set to collect digital stills on ten-second intervals with illumination provided by a dive light. This approach was employed for the last three days of the cruise, collecting 3545 additional images. The SEABOSS collected 120 standard definition video files recorded on an Odyssey digital recorder and a similar number of hours of hi-definition video recorded by a forward-looking GoPro camera. These images and videos will be analyzed over the course of the next year to determine community structure and biodiversity of the sites.
Nighttime operations during the Spring 2018 SEABOSS cruise focused again on collecting physical oceanographic data needed to characterize the Phase II study area. Transects from the 2017 Fall collection period were reoccupied to assess seasonal variation. Several new locations were added during this cruise looking at cross-bathymetric contours in the eastern half and at the eastern entrance to Fishers Island Sound, and near the western limit of the study area south of Clinton Harbor. As with the previous data collection, a single transect was sampled repeatedly during a 12 hour period with the acoustic Doppler current profiler (ADCP) in constant operation. Stations along each transect were also repeatedly sampled with a Sea-Bird Model 9 CTD (conductivity, temperature, depth) providing profiles of the water column temperature and salinity. Location of the sampling is shown in Figure 3.
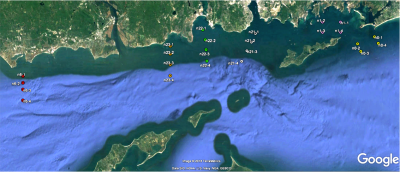
Figure 3. Map providing the locations of the physical oceanographic sampling conducted during the SEABOSS cruise. The dots represent sites where CTD (conductivity, temperature, depth) samples were taken. An acoustic Doppler current profiler (ADCP) was run continuously between these sites.