Sediment texture, which includes shape, size and three-dimensional arrangement of sediment particles, is an essential element of any habitat classification. In addition to grain size information, the total organic content distribution is of great value for the biological habitat classification since it can be an indicator of biological activity. There are abundant old grain size data available, but the seafloor environment is highly variable in places and data several decades old might not reflect the current conditions. While acoustic data can provide information on different grain size composition of the seafloor this information does not contain enough details on the composition to discriminate some benthic habitats. Therefore sediment grain size distribution requires analysis of actual samples.
The following summarize the Sediment Grain size sampling effort conducted jointly by the LDEO and LISMaRC teams. An overview of the Phase I sediment sampling program was reported in the Long Island Sound Study’s Sound Update and can be found here: Sediment Sampling
- Data collected include over 300 grab samples (0 – 2cm), along with ~1600 still photos. Video was collected for over ~140 stations by drifting over them along transects ranging from 300 m to 1 km at ~ 0.5m above the bottom.
- Although the initial grain size measurements conducted by LDEO/Queens systematically differed in the clay content from the USGS measurements, this difference was resolved after reexamining the LDEO/Queens data. A comparison of initial sediment grain size distributions obtained from Queens College using a Sedigraph to those obtained from USGS using a Coulter Counter with sample locations in close proximity revealed a significant fraction of fine clay for many samples analyzed with the Sedigraph. This caused a bias towards finer sediment classes in the first interpretative maps. A thorough investigation has revealed that the Sedigraph did not actually measure higher clay content but indicated a high value in the finest fraction which could be corrected through an adjustment of the instruments baseline value.
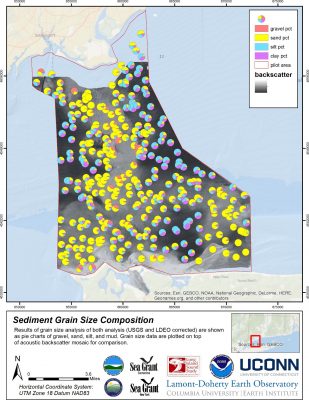
- The detailed grain size data reveal a larger pattern of grain size distribution with finer sediment in the center west, the north and center east and a patch of finer grain size in the south. Stratford Shoals are dominated by coarser sediments. Sandy sediments are found in the center north and along the southern shore. Despite this larger pattern there are variations on a smaller scale throughout the study area.
- While in most areas the acoustic backscatter data and the grain size data correspond well, there are some locations, e.g. south-east corner, where there sandy sediment do not correspond to high backscatter data. This shows that ground verification is essential for interpreting the acoustic data. Obtaining grain size samples where the biological samples are taken is encouraged to ensure that both data sets are collocated to minimize effects of spatial variability.
- The grain size results can be displayed and visualized in various forms including different classification schemes and interpolated percentages of grain size classes. While for most application it might be useful to use the established, modified Shepard classification scheme some of the additional representations might be useful for other future applications.
- Classification schemes can be useful to highlight major trends in the data, but the distinct boundaries could mask real similarities or differences between the data. Samples with compositions directly on either side of the boundary could be more similar than samples inside a class.

Van Veen grab used to sample the Sound’s sediments with a GoPro camera mounted on the frame to photograph the nature of the seafloor where the sample was collected - Additional analysis on the sediment surface samples including carbon, nitrogen, metals, and matrix density provide valuable, additional information without significant additional cost. In general, we observe higher metal concentration in the northern sections of the study area. The majority of measured lead, zinc, and all copper levels measured in the surface grab samples fall at or below the minimal effects ranges with a small minority of lead and zinc levels falling in the possible effects ranges. No values fell into the probable effect ranges. Lead and zinc surface distribution patterns are quite similar to each other and largely track areas with the highest clay and silt concentrations. To a lesser extent Copper is also elevated in the northern sections. Matrix density is indicative of mineral composition and shows low values in the northwest portion of the study site, while higher values occur in the northwestern portion of the study site.
These summary findings were extracted from and can be accessed by clicking on the Phase I Final Report.pdf and Appendixes.pdf.
These are also accessible from the Long Island Sound Study page found here: http://longislandsoundstudy.net/research-monitoring/seafloor-mapping