The Long Island Sound Mapping and Research Collaborative (LISMaRC) is leading the effort to add critical information about the physical oceanographic environment that impacts all of the other attributes of the seafloor habitat mapping initiative. A introduction to the physical oceanographic characterization from the Long Island Sound Study’s Sound Update can be found here: Physical Oceanography
The following summarize the activities and results of the Physical Oceanography team from the Phase I Pilot project.
- A high resolution circulation and hydrographic model, an implementation of the Finite Volume Community Ocean Model (FVCOM), was used to predict currents, temperature, salinity and bottom stresses in the study region.
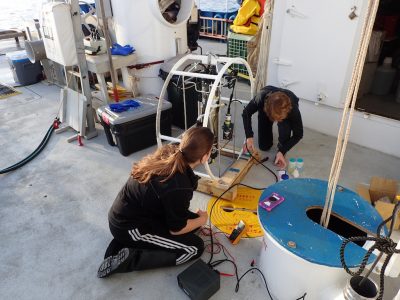
- Six instrumentation platforms were deployed on the bottom of LIS between December 2012 and September 2013 collecting current profiles and water temperature and salinity. These were complimented by two survey cruises in Ocotber 2012 and June 2013 collecting temperature and salinity data. Additional information used in the model calibration process were derived from NOAA tidal data, CT DEEP water quality sampling cruises, USGS/Woods Hole climate data, and offshore bouys.
- The model was used to produce spatial data and mapping products of:
- bottom temperature and salinity distributions throughout the study area for each month;
- spatial structure of the mean and maximum bottom stress magnitude due to (mainly) tidal currents;
- spatial structure of the maximum bottom stress magnitude during a simulation of super Storm Sandy
- spatial structure of the maximum bottom stress magnitude during the entire simulation period excluding those during super Storm Sandy
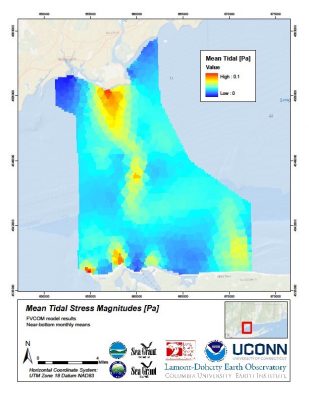
Map of the physical oceanographic model predicting the mean bottom stress generated by tides in the Phase I Pilot area
- The comparison of the model simulations to temperature, salinity, current and bottom stress measurements all show excellent agreement. In the study region, model temperatures were generally within ±1°C of measured values, salinities within ±0.25 ppt, and stresses within ±30%. Note, however, that the estimation of stresses through measurements is also imprecise and that discrepancies between predictions and observations in the stresses may arise from the model’s underestimation (or inability to represent) higher frequency and finer scale motions. This issue could be improved upon by running a higher resolution model in a particular area of interest.
- The spatial and temporal structures of the temperature, salinity, and stress fields captured by the model show excellent agreement with the field studies and clearly support the model’s use as a tool to interpolate spatially between the observations for the purpose of making maps of the characteristics of the bottom environment that are ecologically important.
These summary findings were extracted from and can be accessed by clicking on the Phase I Final Report.pdf and Appendixes.pdf.
These are also accessible from the Long Island Sound Study page found here: http://longislandsoundstudy.net/research-monitoring/seafloor-mapping