Web cookies (also called HTTP cookies, browser cookies, or simply cookies) are small pieces of data that websites store on your device (computer, phone, etc.) through your web browser. They are used to remember information about you and your interactions with the site.
Purpose of Cookies:
Session Management:
Keeping you logged in
Remembering items in a shopping cart
Saving language or theme preferences
Personalization:
Tailoring content or ads based on your previous activity
Tracking & Analytics:
Monitoring browsing behavior for analytics or marketing purposes
Types of Cookies:
Session Cookies:
Temporary; deleted when you close your browser
Used for things like keeping you logged in during a single session
Persistent Cookies:
Stored on your device until they expire or are manually deleted
Used for remembering login credentials, settings, etc.
First-Party Cookies:
Set by the website you're visiting directly
Third-Party Cookies:
Set by other domains (usually advertisers) embedded in the website
Commonly used for tracking across multiple sites
Authentication cookies are a special type of web cookie used to identify and verify a user after they log in to a website or web application.
What They Do:
Once you log in to a site, the server creates an authentication cookie and sends it to your browser. This cookie:
Proves to the website that you're logged in
Prevents you from having to log in again on every page you visit
Can persist across sessions if you select "Remember me"
What's Inside an Authentication Cookie?
Typically, it contains:
A unique session ID (not your actual password)
Optional metadata (e.g., expiration time, security flags)
Analytics cookies are cookies used to collect data about how visitors interact with a website. Their primary purpose is to help website owners understand and improve user experience by analyzing things like:
How users navigate the site
Which pages are most/least visited
How long users stay on each page
What device, browser, or location the user is from
What They Track:
Some examples of data analytics cookies may collect:
Page views and time spent on pages
Click paths (how users move from page to page)
Bounce rate (users who leave without interacting)
User demographics (location, language, device)
Referring websites (how users arrived at the site)
Here’s how you can disable cookies in common browsers:
1. Google Chrome
Open Chrome and click the three vertical dots in the top-right corner.
Go to Settings > Privacy and security > Cookies and other site data.
Choose your preferred option:
Block all cookies (not recommended, can break most websites).
Block third-party cookies (can block ads and tracking cookies).
2. Mozilla Firefox
Open Firefox and click the three horizontal lines in the top-right corner.
Go to Settings > Privacy & Security.
Under the Enhanced Tracking Protection section, choose Strict to block most cookies or Custom to manually choose which cookies to block.
3. Safari
Open Safari and click Safari in the top-left corner of the screen.
Go to Preferences > Privacy.
Check Block all cookies to stop all cookies, or select options to block third-party cookies.
4. Microsoft Edge
Open Edge and click the three horizontal dots in the top-right corner.
Go to Settings > Privacy, search, and services > Cookies and site permissions.
Select your cookie settings from there, including blocking all cookies or blocking third-party cookies.
5. On Mobile (iOS/Android)
For Safari on iOS: Go to Settings > Safari > Privacy & Security > Block All Cookies.
For Chrome on Android: Open the app, tap the three dots, go to Settings > Privacy and security > Cookies.
Be Aware:
Disabling cookies can make your online experience more difficult. Some websites may not load properly, or you may be logged out frequently. Also, certain features may not work as expected.
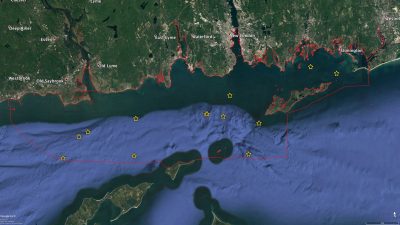
A five-day cruise using the research vessel Connecticut (RV CT) and the Kraken2 (K2) ROV was conducted from May 19-23rd, shortly after the RV CT/SEABOSS cruise. The mission visited 12 of the sample blocks and sites that were identified as being inadequately sampled by the SEABOSS system. This determination was based primarily upon the nature of the substrate being too hard and topographically complex to sample with the SEABOSS. The drift-mode sampling approach of the SEABOSS did not allow extended imaging of the rougher boulder/ledge habitats. The K2 ROV, conversely, is ideally suited to stopping and imaging the vertical surfaces of boulder habitats with great detail with its powerful zoom cameras (both hi-definition video and high resolution digital still). In addition a survey of a previously unidentified wreck site discovered by the SEABOSS was attempted. However, low visibility and high currents precluded adequate documentation of this site. The K2 collected over 30 hours of hi-definition digital video (~2 terabytes) and 412 down-looking and 2050 forward-looking digital still images that will be analyzed over the next year to assess the sites’ community structure and biodiversity.
Map depicting the locations of the Kraken2 ROV Spring 2018 dive sites. The red boundary illustrates the extent of the Phase II area.
The K2 ROV cruise revealed some of the most complex terrain observed in the Sound to date. To see an example video, click on this link: https://youtu.be/XKVNCYrSJwo
The Long Island Sound Cable Fund Habitat Mapping initiative has entered Phase II that is focused on the eastern Long Island Sound area. The LISMaRC was planning field operations in this area for sediment, ecological and physical oceanography characterization in the August-September timeframe. However, delays in the delivery of the RV Connecticut from the shipyard pushed the schedule back into late fall. The available ship time allowed for the conduct of at-sea operations from November 28th – December 3rd. This timeframe allowed for sampling of approximately one-third of the Phase II area and the remainder of the sampling will be conducted in May, 2018. The Fall 2017 cruise was conducted by scientists from the Universities of Connecticut and New Haven and the US Geological Survey’s Woods Hole Marine and Coastal Science Center.
This was the first cruise on the newly stretched (from 76’ to 90’) RV Connecticut that provided more laboratory and berthing space to better accommodate research activities and additional scientists and students. The cruise utilized the US Geological Survey’s SEABOSS (Seafloor Benthic Observation and Sampling System) to both collect sediment samples and image the seafloor using video and still imagery.
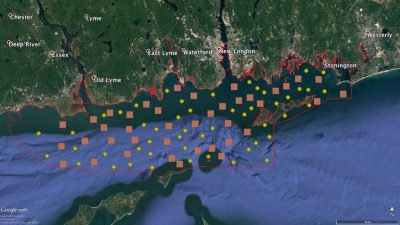
Map showing the outline of the Phase II area (red) and the location of the sample blocks (squares) and sample sites (circles)
The squares represent sample blocks, wherein three individual sediment samples were collected and one photo/video transect of up to 500 meters was conducted. The circles represent sample sites where a single sediment grab was collected and a transect conducted. The sampling areas were chosen based upon the detailed backscatter maps generated by earlier multibeam sonar surveys by the National Oceanic and Atmospheric Administration’s Office of Coast Survey. The backscatter is a measure of the strength of the return of an acoustic pulse generated by the sonar system, which in turn provides a proxy indicator of the nature of the seafloor, with hard bottoms returning a lot of the sound and represented by lighter shades and soft bottoms absorbing more of the sound appearing darker.
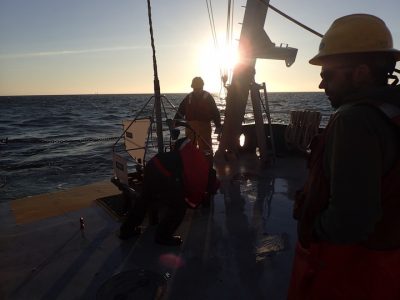
Launching the SEABOSS at sunrise on the first day of operations
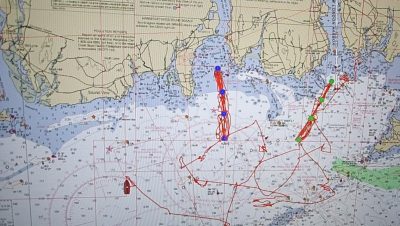
The cruise involved SEABOSS operations during the daylight 12-hour period with physical oceanographic sampling comprised of acoustic Doppler current profiler (ADCP) and conductivity, temperature and depth (CTD) sampling across depth gradients in some of the shallow areas of the Phase II area. The figure below illustrates several of the areas sampled to characterize the physical oceanographic conditions, with the ship’s tracks (red) illustrating the repeated ADCP surveys over the 12 hour evening watch and the circles indicating the locations where repeated CTD profiles were collected to provide detailed data on the temperature and salinity at these locations. This survey protocol will provide important data on the physical strength of the currents and four-dimensional structure of the water column in these poorly sampled shallow areas of the Sound.
Location of two of the physical oceanography sampling areas during the Fall 2017 cruise