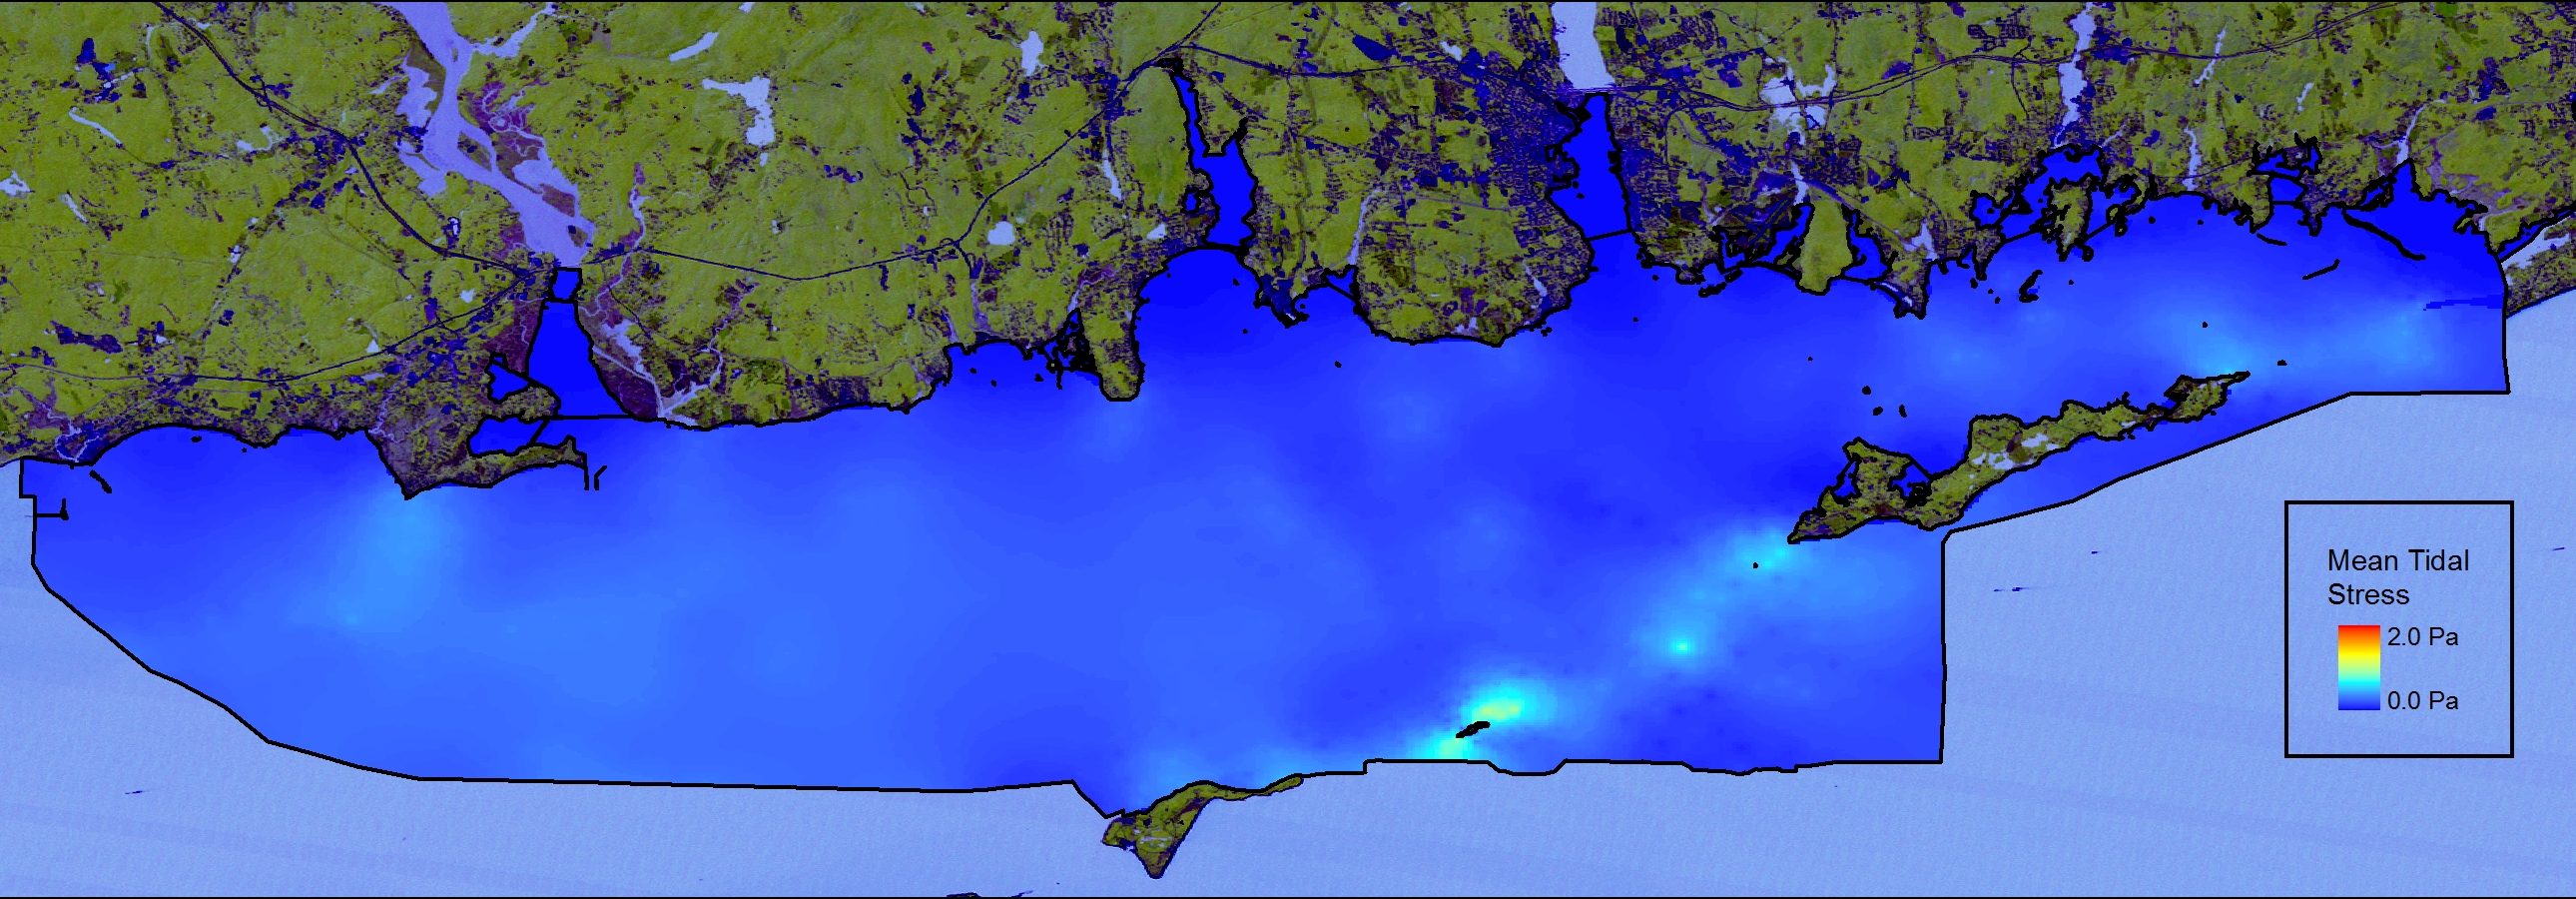
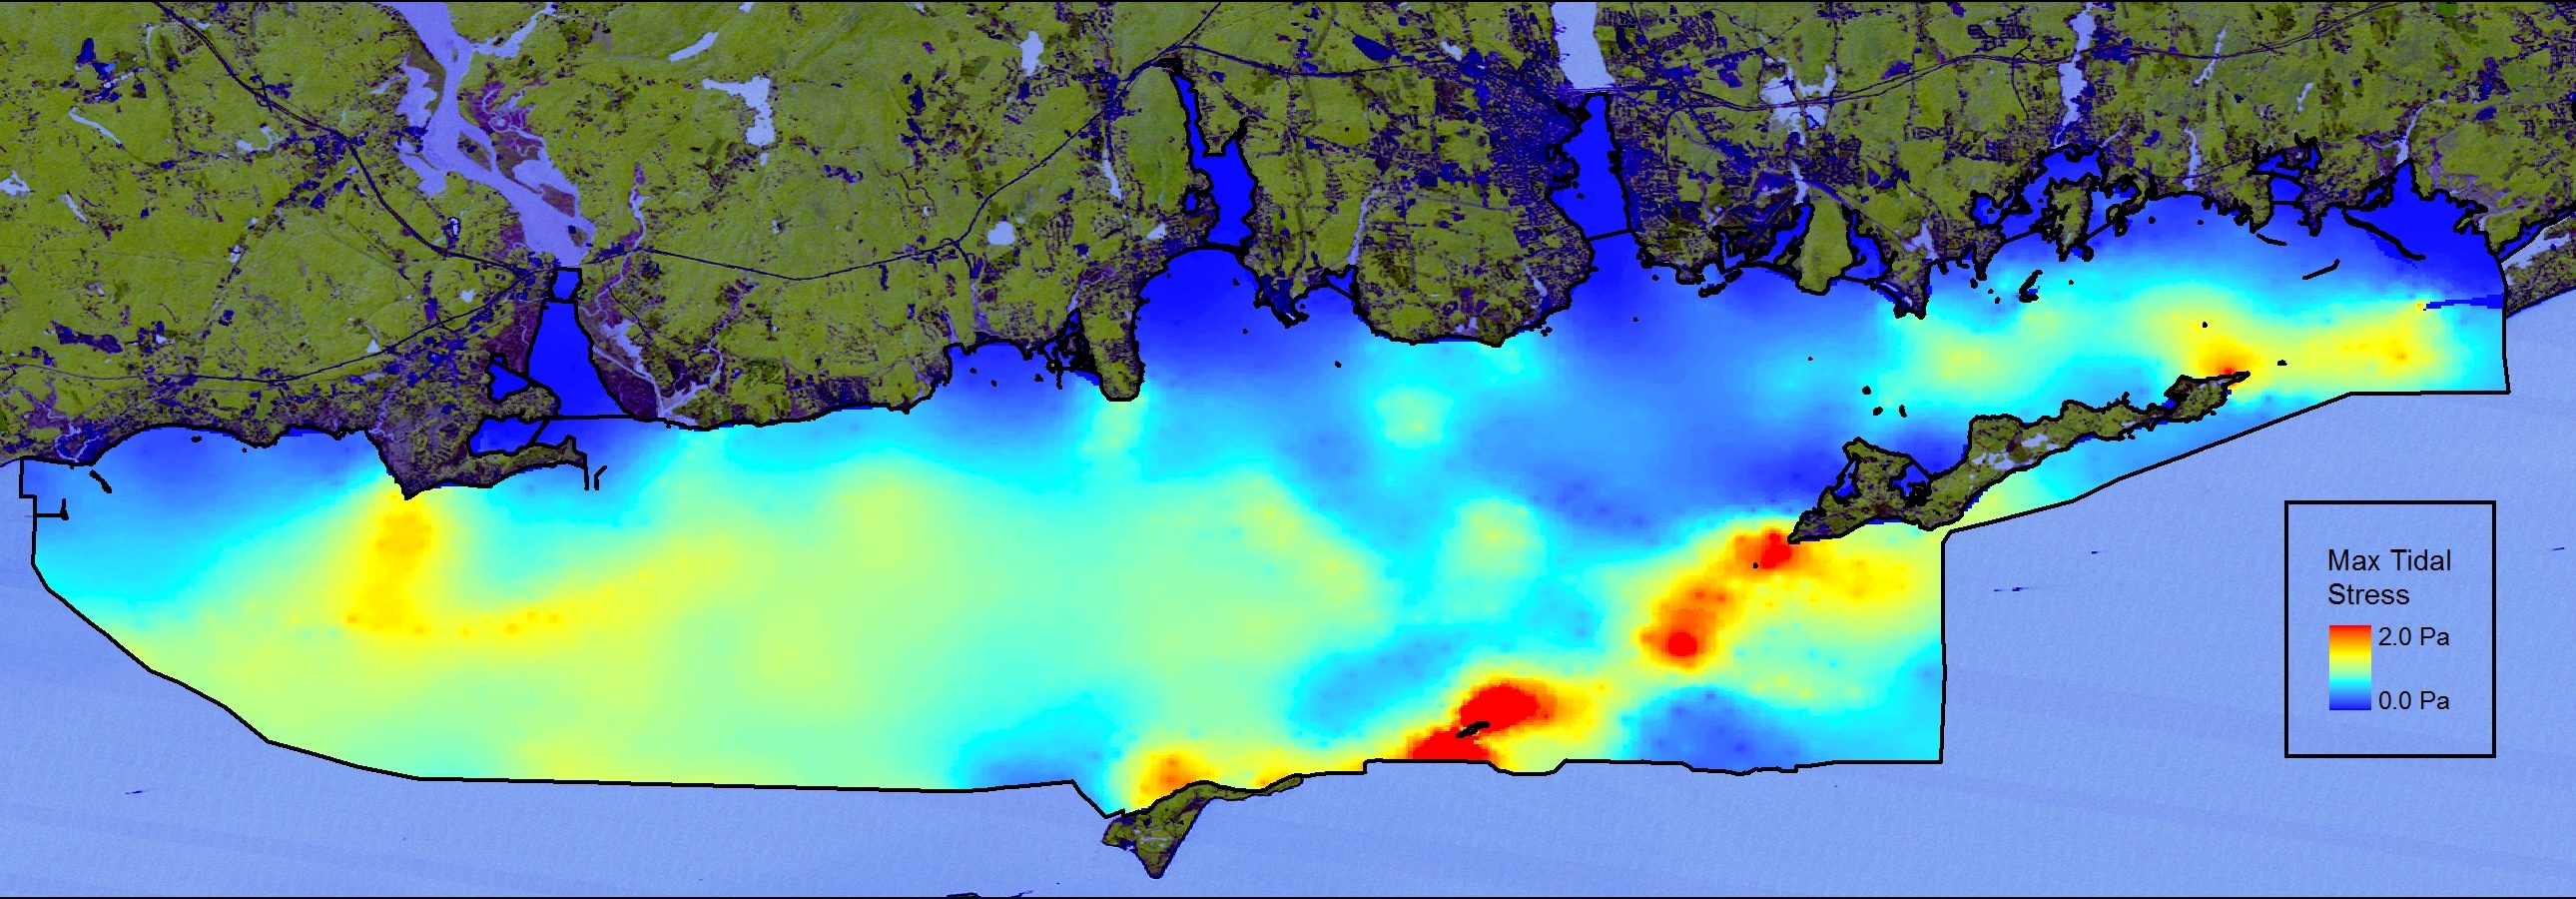
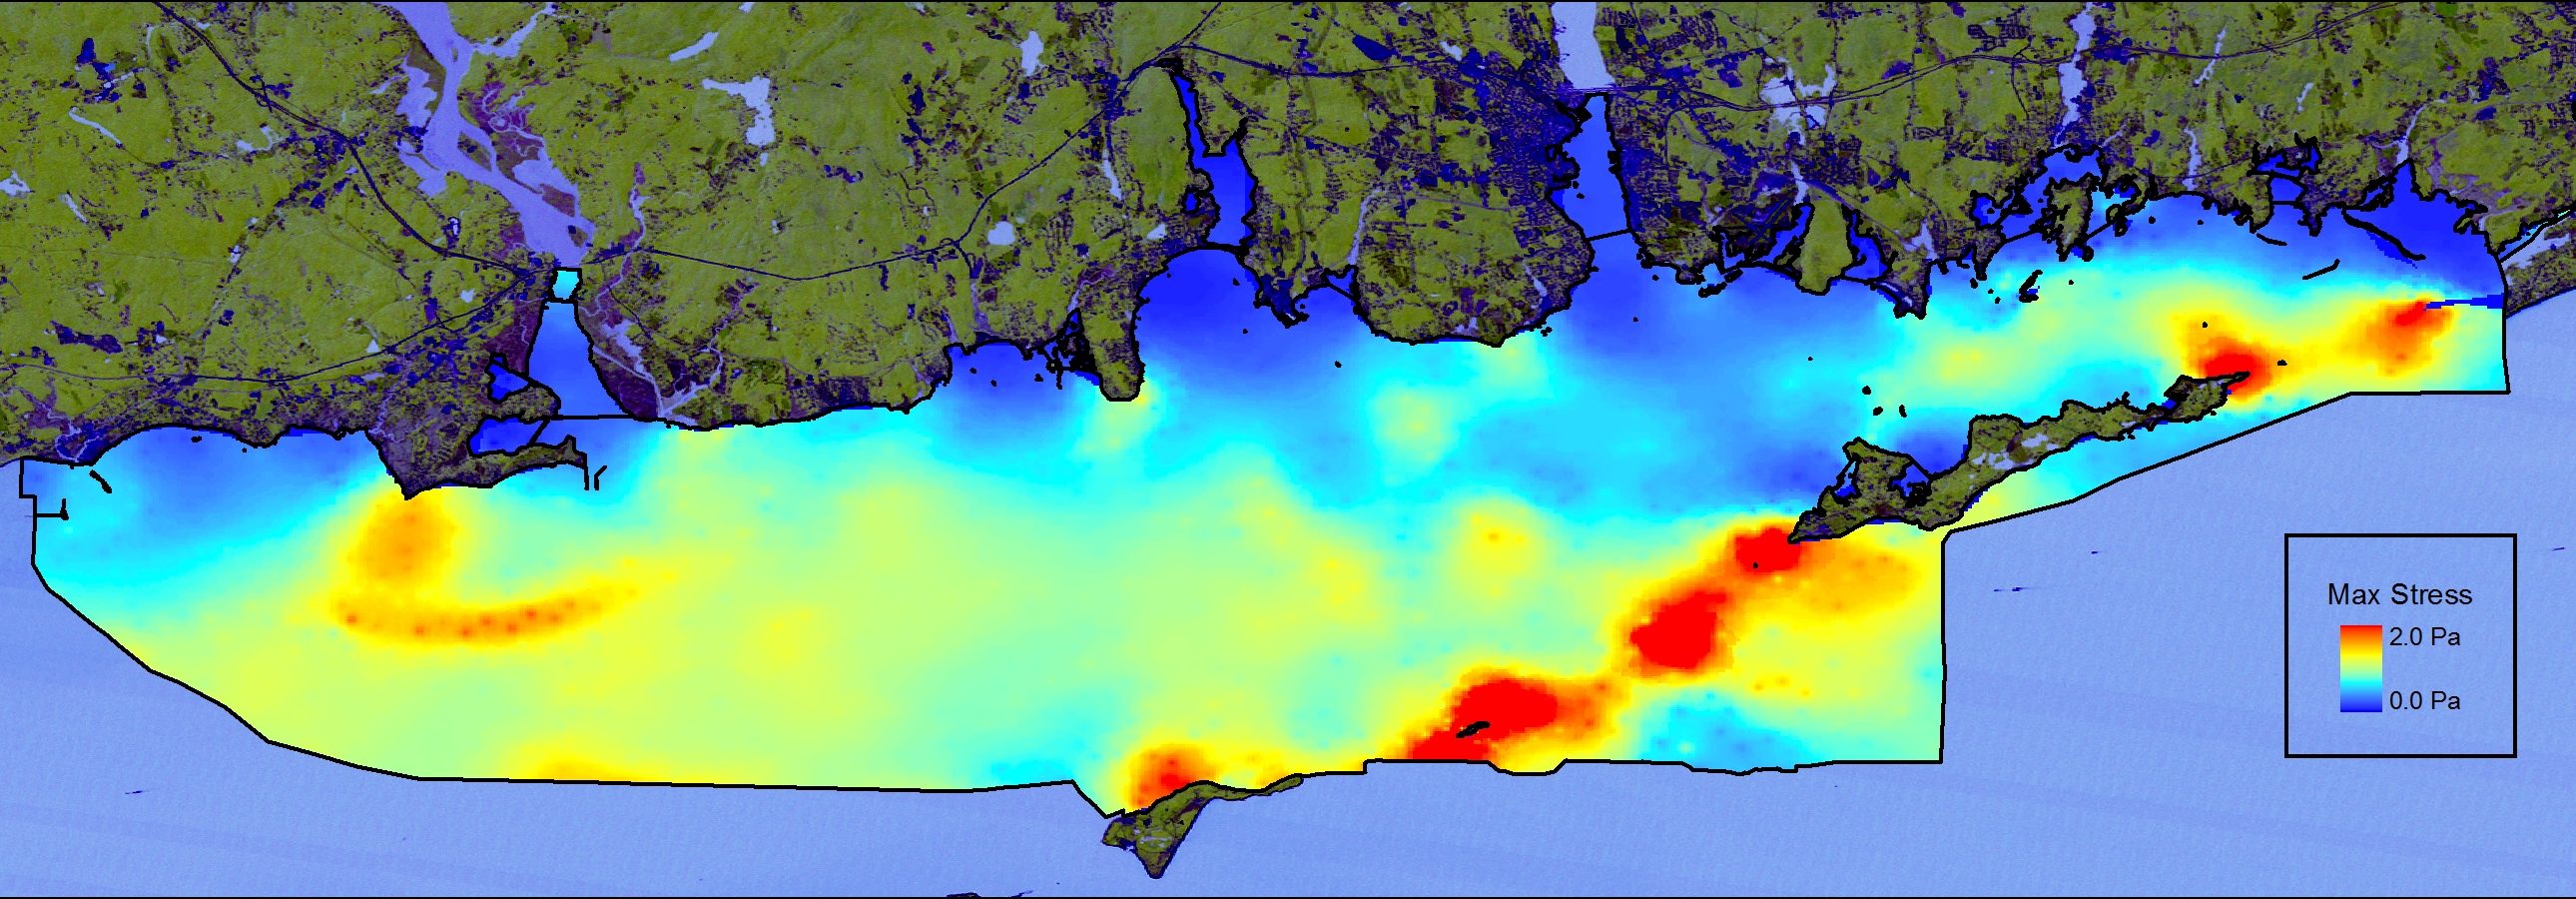
Physical oceanographers at the University of Connecticut’s Department of Marine Science have been developing maps of the physical attributes of the Phase II area of Long Island Sound Habitat Mapping Initiative. These maps include water temperatures, salinity and bottom stress (a measure of the strength of the water movement over the seafloor based upon both tides and storms). The maps are the output of models that have been developed and refined based upon actual data measured in the Phase II area. The observations were made over the course of several months and two research cruises that used a variety of technologies including CTD (conductivity, temperature and depth) sensors, ADCPs (acoustic Doppler current profiler) and long-term seafloor observatory deployments. These maps are a critical element that will be integrated with the other geological and biological data currently being analyzed to provide a more comprehensive understanding of the dynamics of Long Island Sound.
The slideshow provides a series of maps of the bottom stress predicted in the Phase II area. The first map is of the mean bottom stress over a complete tidal cycle. The second shows the maximum stress predicted due to the tides – note the high values around the area known as the Race between Long and Fishers Islands. The third map is the maximum stress predicted that includes data inputs driven by both tides and storms.


