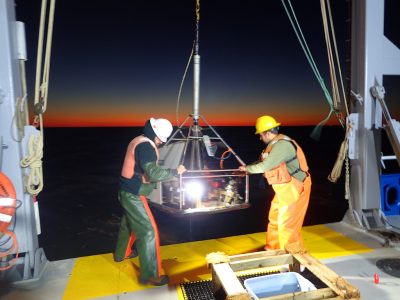
The Long Island Sound Cable Fund Habitat Mapping initiative has entered Phase II, which is focused on the eastern Long Island Sound area (Figure 1). The LISMaRC was planning field operations in this area for sediment, ecological and physical oceanography characterization in the August-September timeframe, however delays in the delivery of the RV Connecticut from the shipyard pushed the schedule back into late Fall. This was the first cruise on the newly stretched (from 76’ to 90’) RV Connecticut that provided more laboratory and berthing space to better accommodate research activities and additional scientists and students. The available ship time allowed for the conduct of at-sea operations from November 28–December 3, 2017. This timeframe allowed for sampling of approximately one-third of the Phase II area and the remainder of the sampling was conducted in May, 2018. The Fall 2017 cruise was conducted by scientists from the Universities of Connecticut and New Haven and the US Geological Survey’s Woods Hole Marine and Coastal Science Center. The cruise utilized the US Geological Survey’s SEABOSS (Seafloor Benthic Observation and Sampling System) to both collect sediment samples and image the seafloor using video and still imagery.
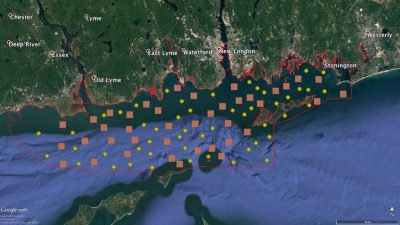
The squares represent sample blocks, wherein three individual sediment samples were collected and one photo/video transect of up to 500 meters was conducted. The circles represent sample sites where a single sediment grab was collected and a transect conducted. The sampling areas were chosen based upon the detailed backscatter maps generated by earlier multibeam sonar surveys by the National Oceanic and Atmospheric Administration’s Office of Coast Survey. The backscatter is a measure of the strength of the return of an acoustic pulse generated by the sonar system, which in turn provides a proxy indicator of the nature of the seafloor, with hard bottoms returning a lot of the sound. By convention, the strong return signal from hard bottom is represented by lighter shades in map products, while the weak return signal from soft bottom is represented by darker shades.
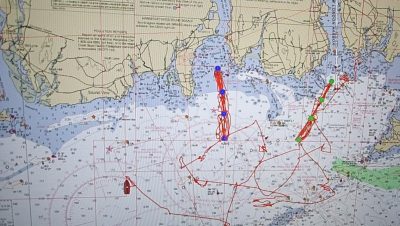
The cruise involved SEABOSS operations during the daylight 12-hour period, while nighttime operations focused on physical oceanographic sampling comprised of acoustic Doppler current profiler (ADCP) and conductivity, temperature and depth (CTD) sampling across depth gradients in some of the shallow areas of the Phase II area. The figure below illustrates several of the areas sampled to characterize the physical oceanographic conditions, with the ship’s tracks (red lines) illustrating the repeated ADCP surveys over the 12-hour evening watch and the circles indicating the locations where repeated CTD profiles were collected to provide detailed data on the temperature and salinity at these locations. This survey protocol will provide important data on the physical strength of the currents and four-dimensional structure of the water column in these poorly sampled shallow areas of the Sound.