The acquisition of high-resolution bathymetry and backscatter data by sophisticated acoustic sonar systems provide a foundation from which all subsequent elements of the habitat mapping initiative are built upon. The bathymetry (water depth) provides detailed information on the seafloor topography, while at the same time providing quantitative data that can be used to develop a number of derived products such as slope, rugosity and topographic roughness indices. The backscatter (reflectance) data provides a proxy for the nature of the seafloor with harder substrates providing a stronger acoustic return from the seafloor contrasted to the softer sediments that absorb much more of the sound from the acoustic survey systems.
Previous Acoustic Surveys in the Phase II Area
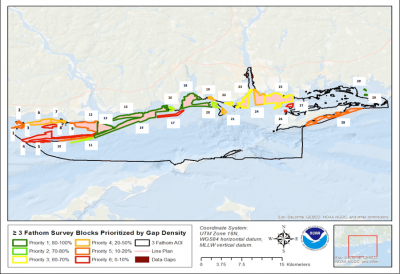
NOAA’s Office of Coast Survey (OCS) and National Centers for Coastal Ocean Science (NCCOS) released a report that analyzed twelve previous surveys conducted in the Phase II area for: 1) data coverage, depth range and area (km2), 2) depth statistics and vertical uncertainty and 3) data gap areas for both bathymetry and backscatter. The result of these analyses was the identification of 30 areas or blocks lacking sufficient acoustic data to be of use to the habitat mapping effort (Figure 1).
In addition, the locations within the Phase II area for which no acoustic data had been previously collected by NOAA were also identified (Figure 2).
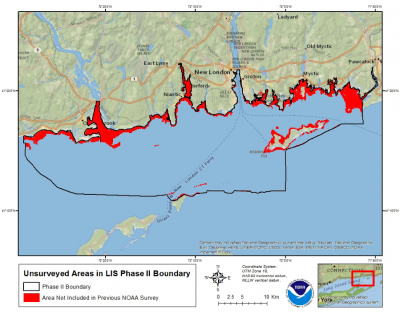 Figure 2. Map of the Phase II area with areas with no previous acoustic surveys shown in red
LISMaRC Acoustic Survey Methods
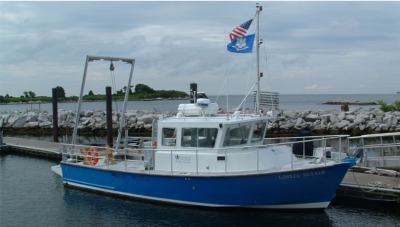
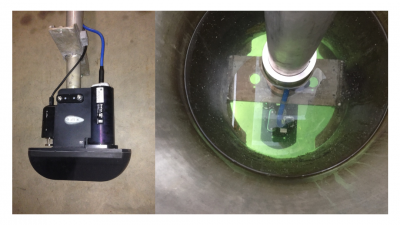
The University of Connecticut’s Research Vessel Lowell Weicker was used to conduct new acoustic surveys in survey blocks 23, 24 and 25 identified above. The Weicker is a 39’ long research vessel with a shallow draft (3’) allowing it to access the majority of the shallow water areas (Figure 3). The Weicker has a center moon pool that was used to deploy UConn’s Geoswath Plus phase differencing bathymetric sonar as seen in Figure 4 (see: https://lismap.uconn.edu/acoustic-technologies/ for more details on acoustic mapping technologies).
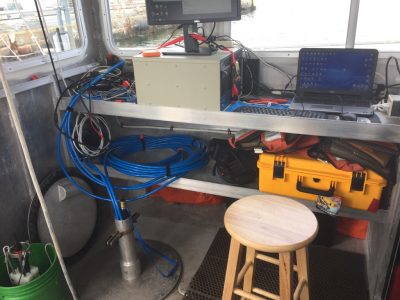
The Geoswath+ acquisition software and hardware was used on board the vessel (Figure 5) to conduct the survey. Sound velocity profiles (SVP) were conducted using UConn’s Valeport system every three hours to acquire sound speed data, critical to ensuring accuracy of the acoustic data. Sound velocity data is imported into the processing software for sound speed corrections. UConn maintains the ACORN (Advanced Continuously Operating Reference Network) that is composed of nine base station GPS receivers in Connecticut, including two in the Phase II area that stream their location data to on-campus computers allowing surveyors real time access to these reference points. The ACORN real-time network data was integrated into the navigation system on the Weicker to provide much more accurate position data for the surveys.
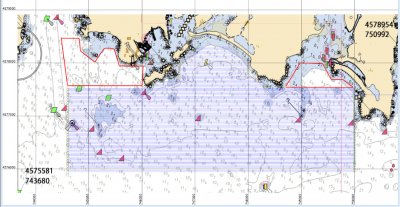
One issue associated with PDBS systems is that due to their side-looking geometry there is a data gap directly below the sonar head, called the nadir. To address this data gap, very tight survey lines seen in blue in Figure 6 below, were set up on the Weicker’s navigation system to provide 100% overlap of each consecutive line. Surveys were conducted intermittently from April through August, 2017 in the 24 and 25 blocks. Additional surveys were conducted in June and July, 2018 in those blocks along with block 23. A total of 120 hours were spent surveying these areas.
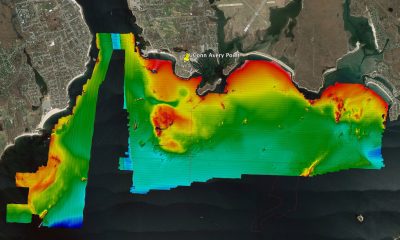
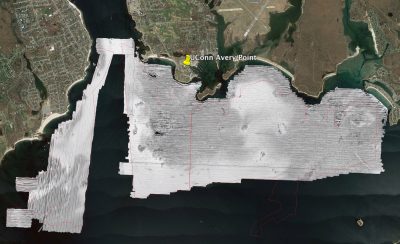
Results of the LISMaRC Acoustic Surveys
The results for the bathymetry and backscatter from these surveys are seen in Figures 7 and 8 below, respectively.