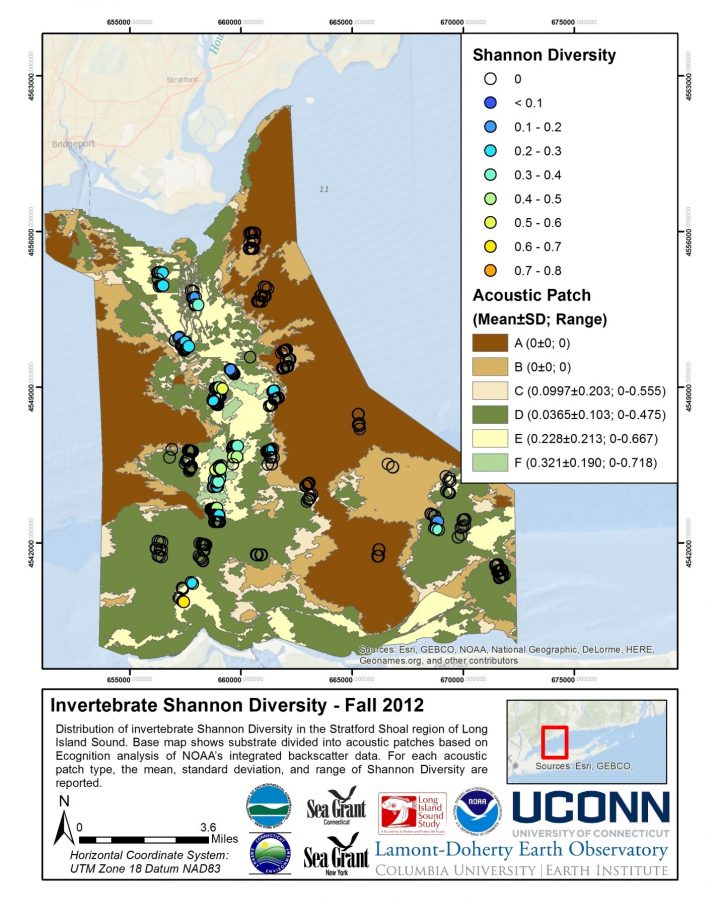
The following summarizes the results of the Epifaunal Characterization of the Phase I Pilot Area Final Report:
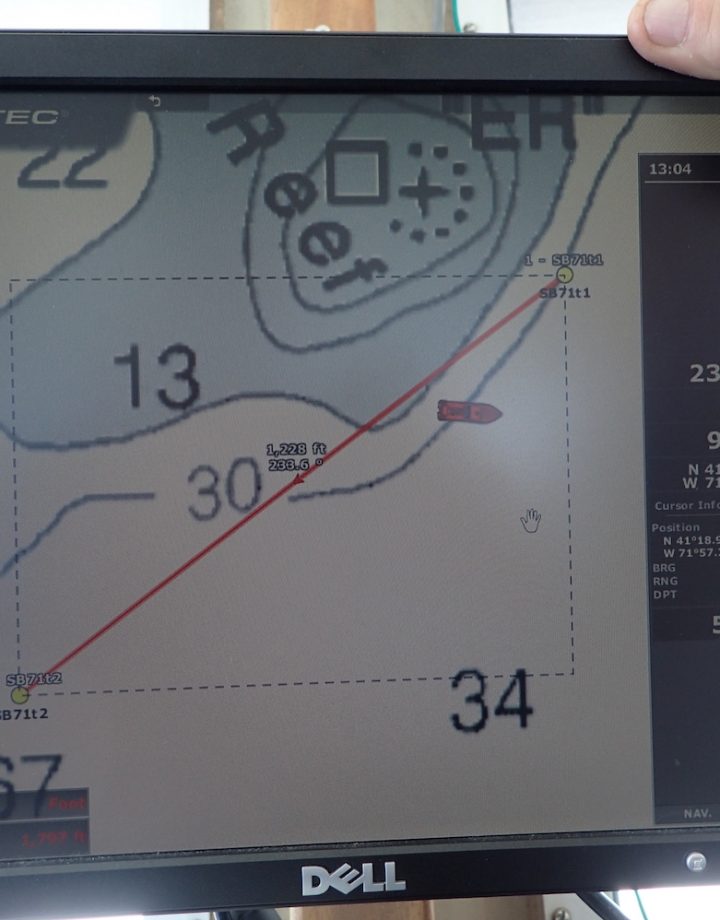
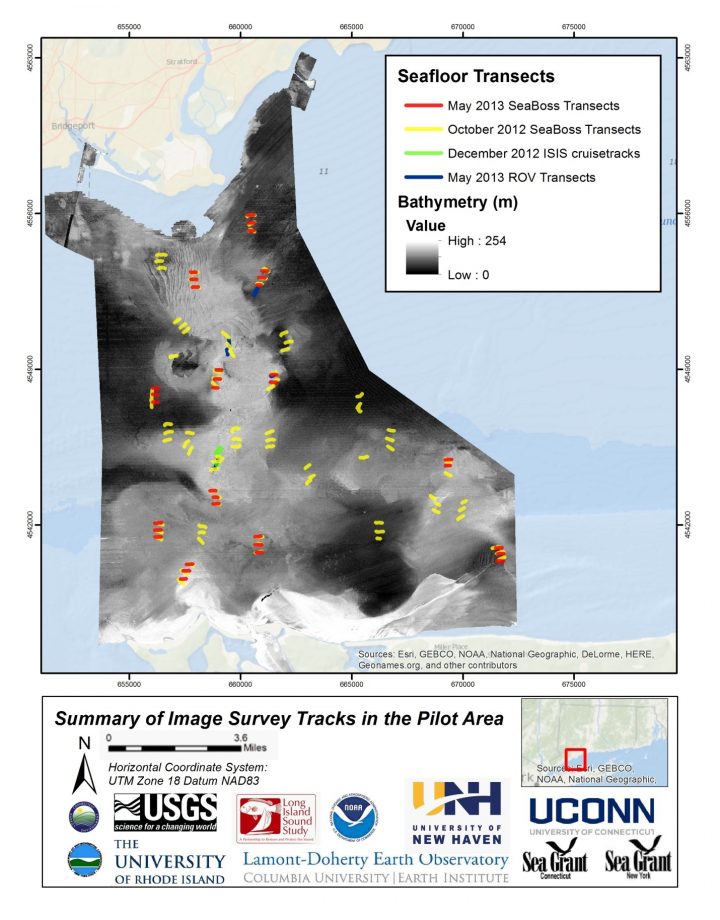
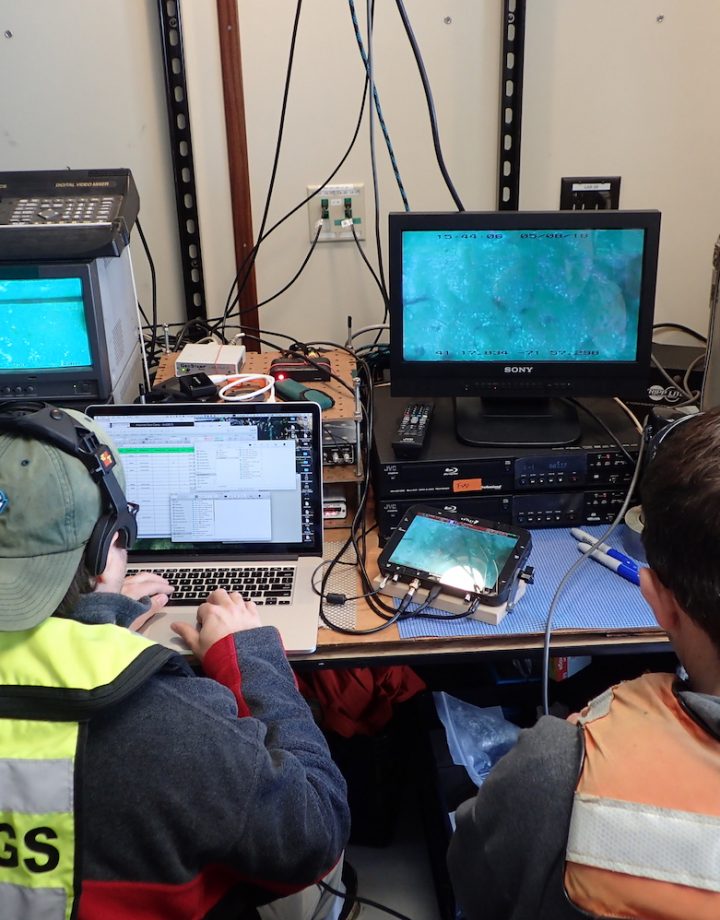
- Seafloor imagery was collected during Fall 2012 and Spring 2013 using three undersea platforms. All acquired digital imagery orthogonal to the seafloor (10-17 October 2012, SEABOSS, 2800 images; 12-13 December 2012, ISIS, 297 images; 13-15 May 2013, Kraken 2, 493 images; 21-24 May 2013, SEABOSS, 1155 images). Images with water turbidity that obscured the seafloor or that were out of focus such that identification of all organisms or biogenic features was impeded were rejected. This step produced a total of 574 processed images for analysis from Fall 2012 sampling (SEABOSS = 517 images, ISIS = 57 images) and 630 images for Spring 2013 (Kraken2 = 49 images, SEABOSS = 581 images).
Here are some representative images and data products from this section of the Final Report. Hover your mouse over the image to stop the scroll and see the caption.
- Community structure:
- Multivariate dispersion indices for both Fall and Spring confirm that variation in community composition can be explained in part based on differences between groups of samples assigned to Ecognition (acoustic) patch types.
- Those taxa and features that consistently contributed the greatest to defining unique community compositions include: Astrangia poculata (coral), Crepidula fornicata (slipper shell limpet), Mytilus edulis (blue mussel), barnacle spp., Corymorpha pendula (hydrozoan), Bostrichobranchus pilularis (solitary ascidian), shell (both intact and broken shell hash), and burrows, among others.
- The overlap observed in the multi-dimensional scaling cluster groupings for both seasons is indicative of the patchy nature of the sedimentary environment and related factors (e.g., slope as it affects small scale erosional and depositional patterns as well as areas where shell and other biological debris accumulate). High spatial variation in assignments of community type by sample unit was common within sample blocks in areas of patchy sedimentary settings
- Diversity Measures – Sampling Effort
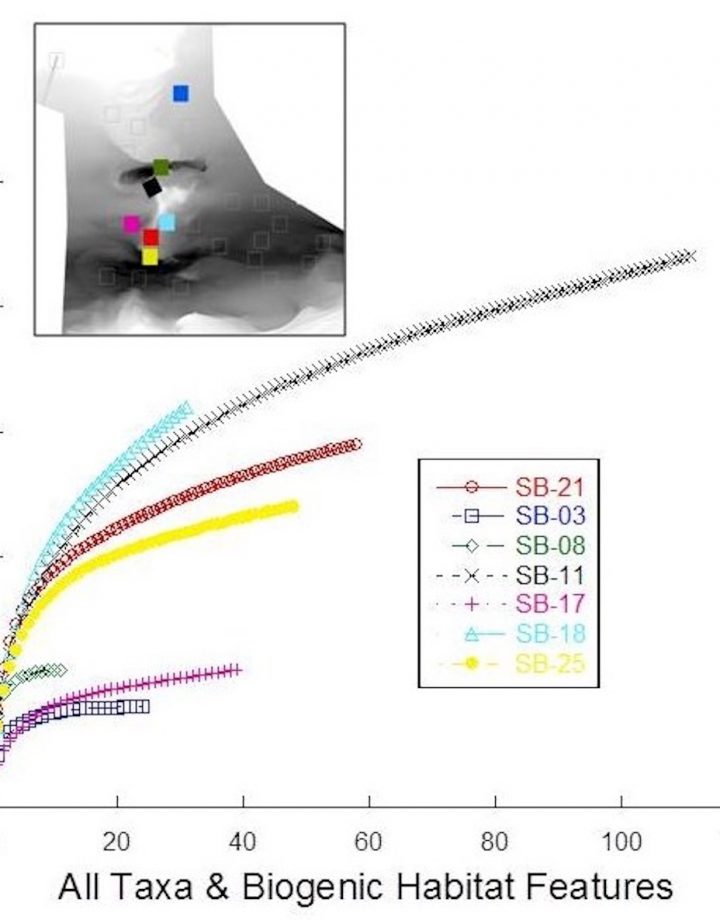
- Species accumulation curves for all species and biogenic features within selected sampling blocks from the initial Fall 2012 cruise illustrate adequacy of image sampling. Richness estimators for all Fall sampling blocks also suggest effort in most blocks was adequate for mapping purposes. That is, dominant fauna in most blocks were accounted for, although greater effort would yield more taxa or features.
- Diversity Measures – Seasonal Variation
- Examination of diversity maps for richness and summary statistics reveals similar patterns diversity. In general, both measures were higher within each season along the shallower coarse grained regions of the pilot area in contrast to the deeper fine grained region. Further, diversity was higher overall in the spring than during the fall season.
- Seasonal differences were most pronounced in the deeper fine grain sediments where Spring recruitment of species with annual life histories occurred, although spatial patterns of diversity were patchy. Observed richness versus predicted richness based on multiple richness estimators suggests that sample sizes within acoustic patch types were adequate.
- The greatest differences between observed and estimated species richness came from the most diverse habitats, those shallow coarse grain features bathed in waters above basin depths. That said, existing samples did differentiate those habitats based on mapping community types.
- Diversity Measures – Species Accounts
- Three examples are useful in illustrating linkages between species and biogenic feature distributions at small spatial scale. Northern star coral (Astrangia poculata) settles and grows on stable hard substratum such as cobble and boulder size rocks. The pilot scale map of coral reflects this distribution but when examined at fine scale, the patchy nature of coral occurrences and variability in cover emerges and is correlated with Ecognition (acoustic) patch types F and E. Blue mussel (Mytilus edulis) also exhibits an affinity to stable sediments although the species can settle and grow on a wider range of grain sizes. Dense aggregations of blue mussel were found in the sand wave habitat in the northern region of the study area and occurred in troughs of the sand waves. Lastly, dense aggregates of shell, an important biogenic feature, are found downslope of the crest of the southern shoal.
- Diversity Measures – Interseasonal Dynamics
- Diversity measures within sampling blocks exhibited highest levels of diversity on the crests of Stratford Shoal within transition areas for both Fall and Spring but highest diversity values occurred in the spring. Shallow communities characterized by relatively long-lived species exhibited a high degree of stability across seasons while deeper fine grain sedimentary settings, characterized by short-lived solitary and colonial species exhibited a high degree of change due to Spring recruitment dynamics. Contrasts between Fall and Spring distributions of Bostrichobranchus, Corymorpha, and amphipod tubes illustrate some of the most dramatic seasonal differences at the spatial scale of the pilot area. As with small-scale variation of community classification and patterns of cover by taxon or feature, there was a high degree of small-scale variation in diversity both within and between seasons within habitats.
- Diversity Measures – Historical Analysis
- Long-term observational data suggested 20+ years of community stability. However, surveys from the Pilot Mapping Program indicate the loss of Haliclona oculata (branching sponge) a previously dominant taxa. However, lack of systematic monitoring and local process studies precludes any understanding of the fine time scale dynamics of change in this community, allowing us to only hypothesize what the drivers of change may be.
The Final Report and Appendixes can be found here: http://longislandsoundstudy.net/research-monitoring/seafloor-mapping
